
The short answer
Revenue is almost always self-reported, because the store publishes no sales data. Treat a founder's Chrome extension revenue number as a claim, then check it against what you can see: the user count, rating count, last update date and pricing page. If those line up, the claim is plausible. If not, keep your doubts.
- The store shows users and ratings, never revenue.
- A revenue screenshot is a claim, not data.
- Check four public numbers against any claim.
- Our crawl stamps each number with the day we saw it.
Chrome extension revenue posts are a bit like fishing photos. The fish is real, probably.
But the angle, the arm held out toward the camera and the choice of which day to post were all picked by the person holding the rod.
What the store does and doesn't show
| Shown on the listing | Not shown anywhere public |
|---|---|
| "Users", as a rounded bucket | Paying customers |
| "Average rating and rating count" | Revenue or MRR |
| "Last updated date" | Churn |
| "Publisher name and website" | Conversion rate |
Based on the public Chrome Web Store detail page, checked 3 Oct 2026. Google's metrics page confirms its Users stat counts installations only.
So every revenue figure you read comes from the founder, an interview or a marketplace listing. A number without a source link is a story. For the wider routine, see our earning guide.
The four-number check for Chrome extension revenue
When you read "my extension makes X a month", look up the listing and note:
- UsersIs the base big enough for the claim, given a modest share paying?
- Rating countA very high user count with only a handful of ratings is odd.
- Last updateA tool earning steady money is usually maintained.
- Pricing pageIs there one, and does the price fit the claim?
Then turn it into a range with the income sum.
Why rating counts help
Ratings are a thin, noisy sample of users, but they're hard to fake at scale. On 3 Oct 2026, Mailtrack had 3M users and 11,808 ratings. Streak CRM had 700K users and 6,543 ratings.
Ratios like those are normal for loved work tools. Odd ratios matter. If a claimed big earner sits at "50,000+ users" with three ratings and no update in two years, slow down.
User counts on the store are rounded buckets. Growth needs history, and ours started on 2 Oct 2026, so we can't yet show change over time for any extension. We'll say so on every page until enough days exist.
A plausibility table
Some claims fit the listing. Others don't. Here's a rough guide to what lines up, using the store's rounded user buckets.
| Claim sounds like | Listing should show | Worth a closer look if |
|---|---|---|
| A side income | A few thousand users, some ratings | No ratings at all |
| A full-time income | Tens of thousands of users, a pricing page | No pricing page anywhere |
| A company-sized business | Hundreds of thousands of users, a web app | Very few ratings, no update in a year |
This isn't a formula. A small, pricey B2B tool can earn well with few users. But when the listing and the claim pull in opposite directions, the claim needs a source.
Where payment shows up
The store has no checkout, so a paid tool sends people somewhere else. In our 3 Oct 2026 crawl, here's how many listings pointed to common payment hosts.
| Host | Listings |
|---|---|
| ExtensionPay | 164 |
| Gumroad | 138 |
| Lemon Squeezy | 111 |
| Polar | 47 |
| Stripe (direct) | 36 |
If a founder claims steady revenue but you can't find any way to pay, on the listing or the website, ask how customers buy. There's usually a simple answer, like a team plan sold by email. Sometimes there isn't.
The sources founders use
Revenue numbers come from a handful of places, and each has its own reliability.
- Payment provider exports: the strongest proof, rarely shared in public.
- Public dashboards: some founders share live revenue pages, which are better than screenshots.
- Interviews and podcasts: useful for context, unchecked by the host.
- Social posts: often a single good month.
- Marketplace listings: buyers ask for proof, so numbers there are tested.
Weigh a claim by where it came from. A live dashboard over many months beats a single viral post. Our guide to thinking in income ranges turns any of these into a range you can plan with.
Worked check: two well-known work tools
Here's the four-number check run on two listings with public paid plans, using our 3 Oct 2026 crawl.
| Check | Mailtrack | Streak CRM for Gmail |
|---|---|---|
| Users | 3,000,000 | 700,000 |
| Ratings | 11,808 | 6,543 |
| Ratings per 1,000 users | About 3.9 | About 9.3 |
| Pricing page | Yes, paid plans | Yes, paid plans |
Both pass. Large user bases, healthy rating counts, and a clear way to pay on each company's site. That makes a revenue claim about either one plausible in shape. It still doesn't tell you the number. Only the companies know that.
Now picture a made-up listing claiming the same kind of revenue with 50,000 users, 4 ratings, no update in two years and no pricing page. Every check points the other way. That's the pattern to slow down on.
Questions to ask a founder
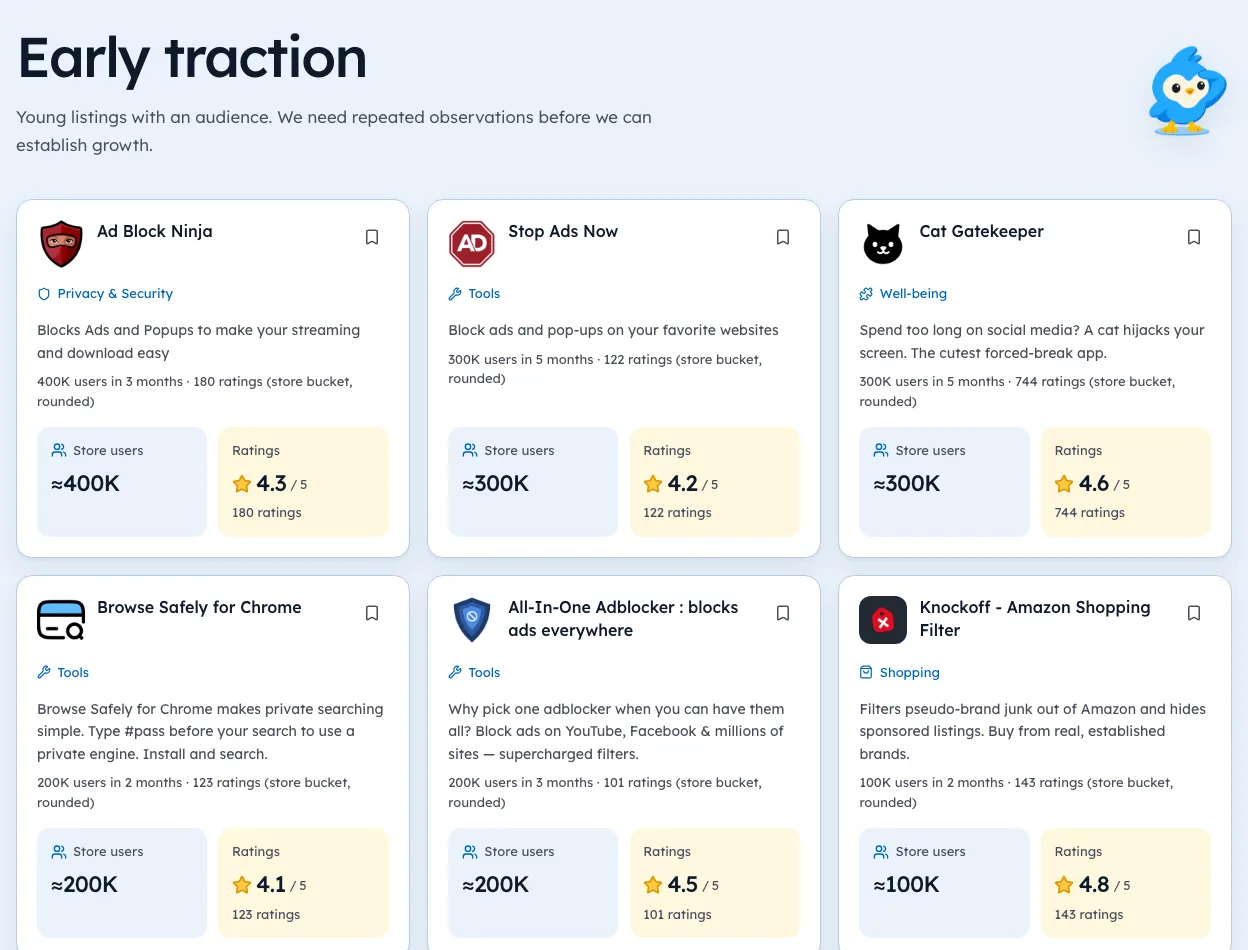
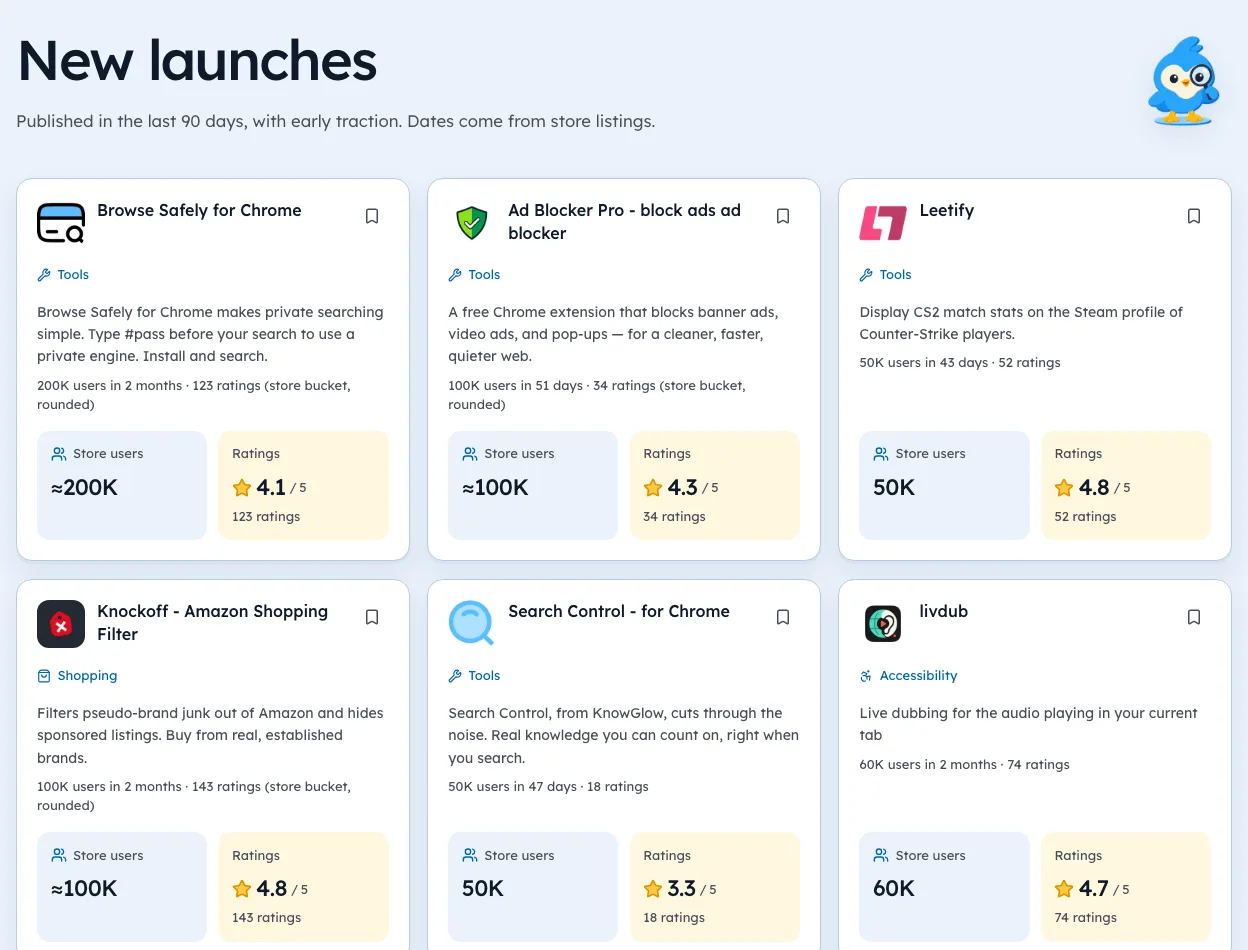
If you can talk to the person behind the number, a few questions turn a claim into something you can weigh. Our New launches page is handy for seeing how young listings in the same space compare before you ask.
- Is that gross revenue or after fees and refunds?
- Is it one month, or the average of the last six?
- How much comes from the extension, and how much from a web app?
- What share of active users pay?
- Can you share a payment provider export under NDA?
Founders who've built something real usually answer the first four without fuss. The fifth is for buyers and investors, not curious readers.
Your own revenue, reported well
If you share your own numbers, a few habits make them useful to others and protect your credibility.
- Say the period, and keep reporting the same one.
- Separate gross and net.
- Include the bad months.
- Link the listing, so readers can see the shape behind the number.
Readers learn more from a steady series than a single peak. You can see where your listing sits against others in its group on our niche pages.
Where honest numbers tend to live
- Founders who share dashboards over months, not one peak screenshot.
- Marketplace listings for selling a business, where buyers ask for proof.
- Company filings, for the rare public company.
- Reddit threads, with care: see what holds up and what fails.
None are perfect. Each still beats one screenshot.
Admire the fishing photo. Then ask to see the scale it was weighed on.
Questions people ask
How much revenue does a typical Chrome extension make?
There's no public data to answer that. Half of the extensions in our crawl had under 760 users (3 Oct 2026), which suggests most earn little.
Are revenue screenshots fake?
Some are real and some aren't. You can't tell from the image, so check the listing.
Can you estimate a competitor's revenue?
Only as a labelled guess from users and price. Never present it as their revenue.
What is MRR for a Chrome extension?
Monthly recurring revenue: what paying subscribers bring in each month. It only applies to subscription plans, not one-time sales.
How can I prove my own extension's revenue?
Export reports from your payment provider. Buyers and partners trust those far more than dashboard screenshots.
What changed
- Updated store figures to our 3 Oct 2026 crawl and added a plausibility table, payment host counts and a guide to the sources founders use.
Where these numbers come from
- developer.chrome.comChrome Web Store: Analyze your store listing metricsAccessed 3 Oct 2026
Part of our guide: How to Make Money with Chrome Extensions: Proof First. More in Make money with extensions.


285 extensions tracked in Amazon & KDP seller tools. See them all.
Open niches with paying users and weak competition, checked against the store. Updated 3 Oct 2026 from our Chrome Web Store crawl