
The short answer
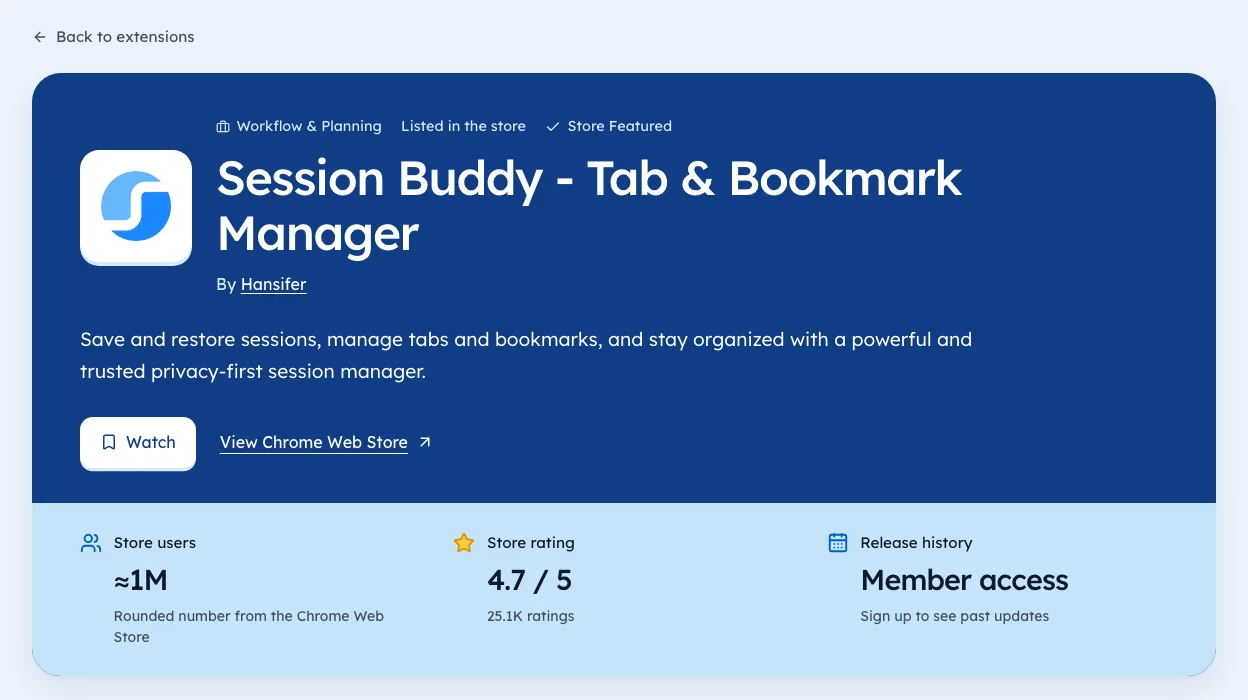
The store's analytics live in the free developer dashboard, and they only cover extensions you publish. You get installs, users, uninstalls and listing traffic for your own work, and nothing about competitors. For the market view, Chrome Web Store analytics means public listing data tracked over time.
- The developer dashboard is free and covers your own listings.
- It shows nothing about other people's extensions.
- Market analytics means tracking public listings by date.
- Pick the tool by the question you're asking.
Chrome Web Store analytics means two different things: the free dashboard for your own items, and public listing data for everyone else's. For the public fields, see Chrome Web Store stats explained.
What the free dashboard gives you
Google's developer dashboard has a stats section for each item you publish. It's the only place you'll see real install and uninstall numbers, and it's free.
Use it first. If you already ship an extension, nothing outside the dashboard knows your numbers better. Our developer dashboard guide explains each stat.
What it can't do
It can't tell you:
- How a rival's user count changed this month.
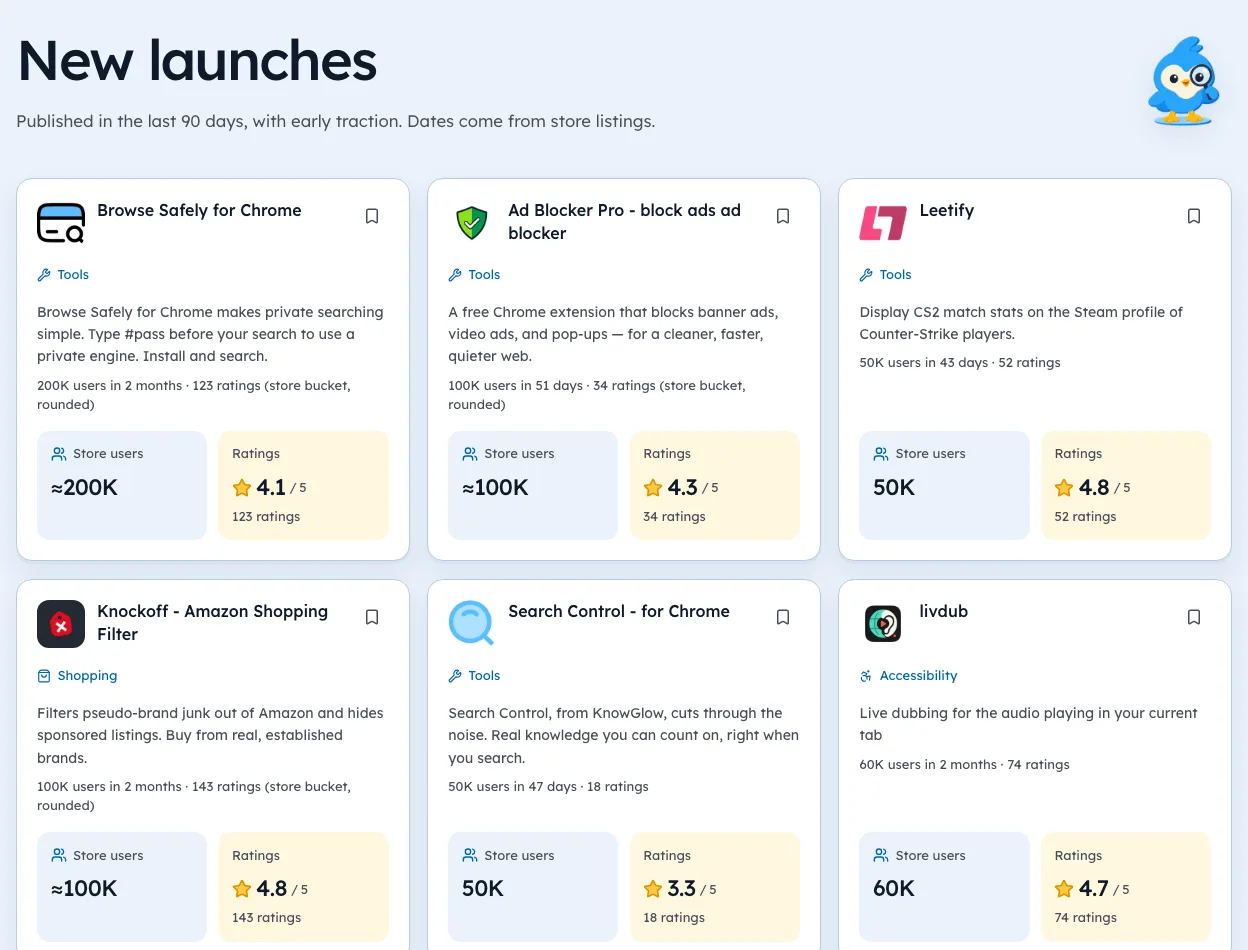
- Which new launches in your category are getting traction.
- Which big extensions haven't updated in a year.
- Whether competitors charge.
Those need public data, recorded on repeat. How to read installs and ratings explains the limits.
For current numbers, open the Tools category page.
Chrome Web Store analytics, side by side
| Question | Developer dashboard | Public-listing tracker |
|---|---|---|
| My installs and uninstalls | Yes, exact | No |
| My listing's traffic sources | Yes | No |
| A rival's user count over time | No | Yes, rounded |
| New launches in my category | No | Yes |
| Rivals with stale updates | No | Yes |
| A rival's revenue | No | No |
That last row is a no for everybody, because payments for extensions run through each developer's own Stripe, Paddle or similar account, and none of those numbers ever reach the public listing. Revenue isn't public.
What each dashboard metric means
The dashboard uses terms that sound alike. Here's what each one tells you, and what it doesn't.
| Metric | What it counts | Watch for |
|---|---|---|
| Installs | New installs in a period | Spikes after posts or launches |
| Uninstalls | Removals in a period | A rise after an update |
| Weekly users | Devices with it installed and active | The steady trend |
| Impressions | Times your listing appeared | Changes after a title edit |
| Page views | Visits to your listing page | Compared with installs |
The most useful number is the share of page views that turn into installs. If people visit but don't install, the listing isn't convincing them. If installs are fine but uninstalls follow, the tool isn't living up to the listing.
Setting a benchmark from public data
Your own numbers mean more next to the market. Public listings give you rough benchmarks. Here's how the whole store looked in our crawl on 3 Oct 2026.
| Users | Extensions |
|---|---|
| Under 1,000 | 31,324 |
| 1,000 to 10,000 | 16,727 |
| 10,000 to 100,000 | 6,149 |
| 100,000 or more | 1,818 |
If you've passed 1,000 weekly users, you're already ahead of nearly half the extensions with a readable count. For a fairer comparison, look at your niche on our niche pages, since a tab manager and an AI writing tool live in very different markets.
Traffic from outside the store
Many installs start somewhere else: a blog post, a video, a community thread. The dashboard shows where store visitors came from, but only in broad terms.
- Tag your links with a source parameter when you share them, so you can tell channels apart.
- Use your own site as a landing page for big posts, with a clear button to the store.
- Note dates of posts and launches in a simple log, so you can match spikes later.
This turns a vague "installs went up" into "the Tuesday tutorial brought 300 installs", which is something you can repeat.
Reading competitors' public numbers
For rivals, all you get is the listing. That's still a lot if you read it on repeat.
- Users, as a rounded bucket.
- Rating and rating count, the best sign of real activity.
- Version and update date, to see who's still shipping.
- Permissions, which hint at new features.
Our guide to reading competition explains how to turn these into decisions. The New launches page shows which young listings already have an audience.
Questions each source can answer
It helps to start from the question, then pick the source. Here's a quick guide.
| Question | Best source |
|---|---|
| Did my last update cause uninstalls? | Developer dashboard |
| Which post brought installs last week? | Tagged links plus the dashboard |
| Is a rival still shipping? | Their public listing, checked over time |
| How big is this niche? | Public listings across the niche |
| Do rivals charge? | Their websites and pricing pages |
| What do users complain about? | Store reviews, read in your browser |
No single tool answers all six. The dashboard covers the first two. Public data and a little reading cover the rest. Our guide to sizing competition shows how to answer the fourth in ten minutes.
Setting up events in your extension
The store's numbers stop at install. To know what users do after that, add a few events of your own. Keep it small and respectful of privacy.
- First run completed, so you know who got started.
- Main action used, counted per day.
- Upgrade clickedand upgrade completed, if you charge.
- Settings changed, to spot confusing defaults.
Declare what you collect in the dashboard's privacy fields and in your privacy policy. Collect counts, not page contents. Our guide to store policy covers what reviewers expect.
A monthly analytics review
Once a month, put both views side by side for half an hour.
- Your installs, uninstalls and weekly users, with the month's changes.
- Your rating count and average, with any new complaints.
- Five rivals' users, rating counts and update dates, from their listings.
- One decision for next month, written down.
The decision is the point. Analytics that don't change what you do are just numbers. You can pull rivals' listing facts from our extension search, each with the date we checked.
How to use both
- Watch your own dashboard weekly for installs and uninstalls.
- List your five closest competitors.
- Track their users and rating counts on the same day each week.
- Note any version updates and permission changes.
- Check their websites monthly for pricing changes.
Ext Watch's extension pages show users, rating count, version and permissions for listings we've crawled. Our own history started on 2 Oct 2026, so day-by-day lines get more useful each week. We're biased, obviously.
A spreadsheet works too if you keep the dates.
Your dashboard tells you how you're doing. The market tells you why.
Start with the free dashboard. Add the market view when your question outgrows it.
Questions people ask
Does the Chrome Web Store have analytics?
Yes, for developers, on their own items, in the developer dashboard. It's free.
Can you see another extension's analytics?
Only its public listing: users, ratings, version and updated date. Not its internal stats.
Can you connect Google Analytics to a Chrome Web Store listing?
Google has supported linking a Google Analytics property to your listing page. Check the current developer docs, since options change.
Why do my weekly users differ from total installs?
Installs count every time someone added the tool. Weekly users count devices where it's still installed and active. Uninstalls and idle devices make up the gap.
How do I know if my numbers are good?
Compare against public listings in your niche. In our 3 Oct 2026 crawl, the median extension had about 760 users, and 7,967 of 65,655 had 10,000 or more.
What changed
- Added a guide to each dashboard metric, a weekly reading routine with real store benchmarks from our 3 Oct 2026 crawl, and a section on tracking traffic from outside the store.
Where these numbers come from
- developer.chrome.comChrome Web Store developer documentationAccessed 3 Oct 2026
Part of our guide: Chrome Web Store Stats Explained, One Field at a Time. More in Chrome Web Store data.


4,821 new extensions in the last 30 days in Tools. See them all.
Users, ratings and changes over time for every listing we track. Updated 3 Oct 2026 from our Chrome Web Store crawl