
The short answer
Ratings bunch near the top, so a 0.1 drop matters more than it looks. Among 18,079 extensions with 10 or more ratings in our 3 Oct 2026 crawl, the median was 4.42 stars. Slipping from 4.5 to 4.4 can move a listing from the top band of Chrome Web Store ratings into the middle of the pack.
- Median rating, 10+ ratings: 4.42 stars (observed 3 Oct 2026).
- 8,240 of those 18,060 sit at 4.5 or above.
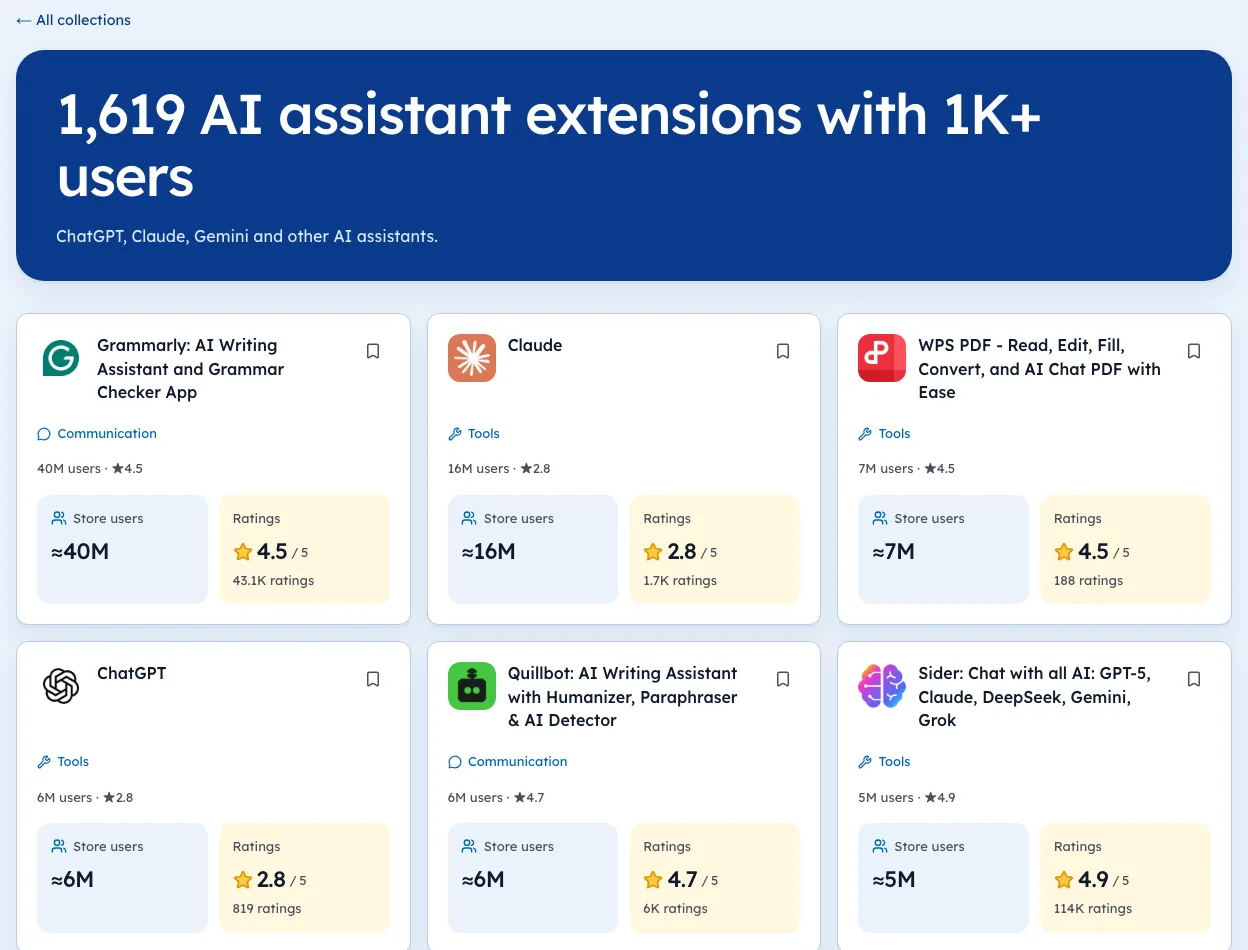
- Bigger extensions rate lower: 1M+ user tools average 3.78.
- We can't yet price a 0.1 drop in installs. Nobody outside Google can.
A star rating is a bit like a restaurant's hygiene score taped to the window. People glance at it for half a second. That half-second decides whether they read anything else. Ratings also feed the wider picture in Chrome Web Store SEO.
Where Chrome Web Store ratings actually sit
We looked at every crawled extension with at least 10 ratings. Fewer than that and one angry review swings the average by a full star.
| Rating band | Extensions | Share |
|---|---|---|
| 4.5 and up | 8,259 | 46% |
| 4.0 to 4.49 | 4,810 | 27% |
| 3.5 to 3.99 | 2,560 | 14% |
| 3.0 to 3.49 | 1,299 | 7% |
| Under 3.0 | 1,151 | 6% |
Lifetime averages from our crawl of 65,655 extensions, observed 3 Oct 2026.
Almost half sit at 4.5 or higher. So 4.5 isn't a mark of excellence. It's roughly the median ticket to the conversation.
Why a 0.1 drop is louder than it sounds
The store shows one decimal. A tool at 4.46 displays 4.5. A tool at 4.44 displays 4.4. That two-hundredths of a star is invisible in the data and very visible on the card.
So what does the drop cost in installs? Honestly, we can't tell you yet. Our own history started on 2 Oct 2026, and measuring that needs months of before and after.
For current numbers, open the Tools category page.
Big tools rate lower, and that's normal
| Users (store bucket) | Extensions with 10+ ratings | Avg rating |
|---|---|---|
| Under 1K | 2,445 | 4.40 |
| 1K+ | 8,589 | 4.28 |
| 10K+ | 5,337 | 4.15 |
| 100K+ | 1,379 | 4.07 |
| 1M+ | 329 | 3.78 |
Observed 3 Oct 2026. User counts are the store's rounded buckets.
Small tools get rated mostly by fans and friends. Big tools get rated by people who had a bad Tuesday. Compare a rating only against tools of the same size.
What tends to cause a drop
Ratings rarely fall for no reason. When we read the newest reviews on listings that lost stars, the same causes come up again and again.
| Cause | What users write |
|---|---|
| A broken update | "Stopped working after the update" |
| A new paywall | "Used to be free" |
| A redesign | "Can't find the button any more" |
| A site change | The tool broke because the site it works on changed |
| New permissions | "Why does it need this now?" |
Most of these are fixable within a week. The faster the fix, the fewer one-star reviews pile up.
How to recover from a drop
A lifetime average moves slowly, so recovery takes patience. These steps help.
- Find the causein the newest reviews.
- Ship a fix, and say what it fixes in the update notes.
- Reply to each complaintwith the fix.
- Ask happy users for a ratingat a moment the tool helps them.
- Track the count and the averageweekly, with dates.
Don't offer anything in return for ratings. Google's policies treat incentivised ratings as spam, and our guide to bought installs shows how that ends.
Ratings by category
Some categories rate higher than others, so compare within yours. Average ratings by category in our 3 Oct 2026 crawl:
| Category | Avg rating |
|---|---|
| Travel | 4.61 |
| Well-being | 4.58 |
| Communication | 4.41 |
| Functionality & UI | 4.36 |
| Workflow & Planning | 4.13 |
| Art & Design | 4.11 |
| Accessibility | 4.10 |
A 4.2 in Accessibility sits above that category's average. The same 4.2 in Travel sits well below. Our categories pages show each one with its counts.
The perfect 5.0 trap
A flawless score looks great on a card. It usually means very few people rated. In our 3 Oct 2026 crawl, 16,181 extensions showed a 5.0 average. Of those, 14,727 had fewer than 10 ratings.
| What you see | What it usually means |
|---|---|
| 5.0 from 3 ratings | The maker, friends or early fans |
| 4.9 from 200 ratings | A small tool people really like |
| 4.5 from 10,000 ratings | A well-loved tool at scale |
| 4.0 from 50,000 ratings | Average for a very large tool |
That's why the rating count belongs next to the stars every time. A 5.0 from three people tells you almost nothing, and a 4.5 from thousands are a much stronger sign.
Reading a rating like a buyer
If you're installing a tool, a few quick checks beat staring at the stars.
- Look at the count first. Under 20 ratings, the average can swing a lot.
- Sort reviews by newest. The lifetime average can hide a recent problem.
- Check the last update. A drop in rating after an update often points to a bug.
- Compare with tools of the same size, using the table above.
Highly rated big tools exist. On 3 Oct 2026, Sider had a 4.92 from 114,491 ratings and GoFullPage a 4.89 from 84,154. Scores like that at that scale are rare, which is what makes them meaningful.
For builders: what a rating is worth
We can't yet measure how much a rating change moves installs, since that needs months of our own readings. What we can say is where your rating sits against others, and that's useful on its own.
- Find your size band in the table above.
- Find your category average in the category table.
- If you're below both, the newest reviews will usually tell you why.
- If you're above both, protect it: ship small, test updates and reply to every complaint.
You can see how rivals in your space compare on our niche pages, with ratings and counts dated.
What to do with a rating you're watching
- Note the rating and the rating count together, with the date.
- Put it in its size band from the table above.
- Check again in 30 days. One reading tells you a level, not a direction.
- Read the newest reviews on the store when it moves, as our reviews guide suggests.
We're biased, since we build Ext Watch, but this is the thing it's for. Our extension pages show rating and rating count with the date we saw them, and they won't call a rating's direction until we have 30 days of our own readings.
Next time you glance at that half-second number, check the size band first.
Questions people ask
How are Chrome Web Store ratings calculated?
The store shows an average of user star ratings, rounded to one decimal. Google doesn't publish more detail than that.
Is 4.0 a good rating?
For a tool with 100,000+ users, it's close to average. For a small tool, it's below the middle.
What is the average rating on the Chrome Web Store?
As of 3 Oct 2026, the median among 18,079 crawled extensions with 10 or more ratings was 4.42 stars.
Which categories have the highest ratings?
In our 3 Oct 2026 crawl, Travel (4.61) and Well-being (4.58) had the highest average ratings, while Accessibility (4.10) and Art & Design (4.11) were lowest.
Can I reset my extension's rating?
No. The rating is a lifetime average. The only way to move it is new ratings from happy users over time.
What changed
- Refreshed both tables to our 3 Oct 2026 crawl, and added what tends to cause a drop, how to recover, and ratings by category.
Where these numbers come from
- developer.chrome.comChrome Web Store discovery docsAccessed 3 Oct 2026
Part of our guide: Chrome Web Store SEO: titles, descriptions, screenshots. More in Growth and ranking.


4,821 new extensions in the last 30 days in Tools. See them all.
Extensions gaining users fastest, and what they changed. Updated 3 Oct 2026 from our Chrome Web Store crawl